













Latency and throughput are two important concepts used to understand the performance of a system.
They are related, but they answer two different questions.
Latency asks: How long does one request take?
Throughput asks: How much work can the system handle in a given amount of time?
What Is Latency?
Latency is the time taken to complete an operation or receive a response.
For example, suppose a user calls:
GET /api/products/100If the API responds in 150 milliseconds, the latency is approximately 150 milliseconds.
sequenceDiagram
    User->>API: Request
    API->>Database: Query
    Database-->>API: Result
    API-->>User: Response
The time between sending the request and receiving the response is the request latency.
Real-World Example of Latency
Imagine you are using a food delivery application.
You search for restaurants near you.
If the results appear in 200 milliseconds, the application feels responsive.
If the results take 8 seconds, the application feels slow.
The number of requests the system can process is not the first concern here. The immediate concern is how quickly one request receives a response.
What Is Throughput?
Throughput is the amount of work a system can process during a specific period.
For APIs, throughput is commonly expressed as:
Requests per second, or RPS.
For example:
1,000 requests per secondmeans the system can process approximately 1,000 requests every second under the measured conditions.
Real-World Example of Throughput
Imagine an online ticket booking system.
During normal hours:
500 requests per secondDuring a popular event:
20,000 requests per secondThe system must be designed to handle the increased workload.
flowchart LR
    Users --> LoadBalancer
    LoadBalancer --> API1
    LoadBalancer --> API2
    LoadBalancer --> API3
    API1 --> Database
    API2 --> Database
    API3 --> Database
Multiple API servers can increase the amount of traffic that the application can process.
Latency vs Throughput
| Latency | Throughput |
|---|---|
| Time taken for an operation | Amount of work processed |
| Usually measured in milliseconds or seconds | Usually measured in requests per second |
| Focuses on response time | Focuses on processing capacity |
| Example: 100 ms | Example: 10,000 requests/sec |
A Simple Example
Suppose an API takes 100 milliseconds to process one request.
If requests are processed one after another by a single worker, the theoretical processing capacity would be roughly:
1 second / 0.1 second = 10 requests per secondBut real systems are more complicated because they use concurrency, multiple threads, multiple servers, database connections and other resources.
For example, if we have multiple API servers:
flowchart LR
    User --> LoadBalancer
    LoadBalancer --> API1
    LoadBalancer --> API2
    LoadBalancer --> API3
    LoadBalancer --> API4
The overall throughput can increase because multiple requests can be processed concurrently.
ASP.NET Core Example
Consider this API:
[HttpGet("products")]
public async Task GetProducts()
{
    var products = await _context.Products
        .AsNoTracking()
        .Take(20)
        .ToListAsync();

    return Ok(products);
}
Suppose this API has:
Average latency = 100 ms
Throughput = 2,000 requests/second
The 100 milliseconds describes how long requests take on average.
The 2,000 requests per second describes how much traffic the system can process under the measured conditions.
Can Low Latency and High Throughput Exist Together?
Yes.
A well-designed system can aim for both low latency and high throughput.
For example:
Latency = 50 ms
Throughput = 20,000 requests/second
But achieving this depends on the workload and architecture.
Increasing throughput can sometimes increase latency if resources become saturated.
How Database Performance Affects Latency
Suppose our API needs to query SQL Server.
flowchart LR
    User --> API
    API --> Database
    Database --> API
    API --> User
Imagine:
API processing = 20 ms
Database query = 500 ms
Network = 30 ms
The database query becomes a major contributor to the overall latency.
Optimizing the API code alone may not solve the problem.
We may need to optimize the SQL query and indexes.
CREATE INDEX IX_Orders_UserId
ON Orders(UserId);
How Caching Can Reduce Latency
Suppose a product is requested frequently.
Without caching:
flowchart LR
    User --> API
    API --> Database
    Database --> API
    API --> User
With caching:
flowchart LR
    User --> API
    API --> Cache
    Cache --> User
    API --> Database
    Database --> Cache
If the requested data is already in the cache, the application can avoid a database call.
This can reduce latency and database workload.
Throughput and Database Bottlenecks
Suppose we increase the number of API servers.
flowchart LR
    LoadBalancer --> API1
    LoadBalancer --> API2
    LoadBalancer --> API3
    LoadBalancer --> API4

    API1 --> Database
    API2 --> Database
    API3 --> Database
    API4 --> Database
The API layer may now process more requests.
However, all four servers are still sending requests to the same database.
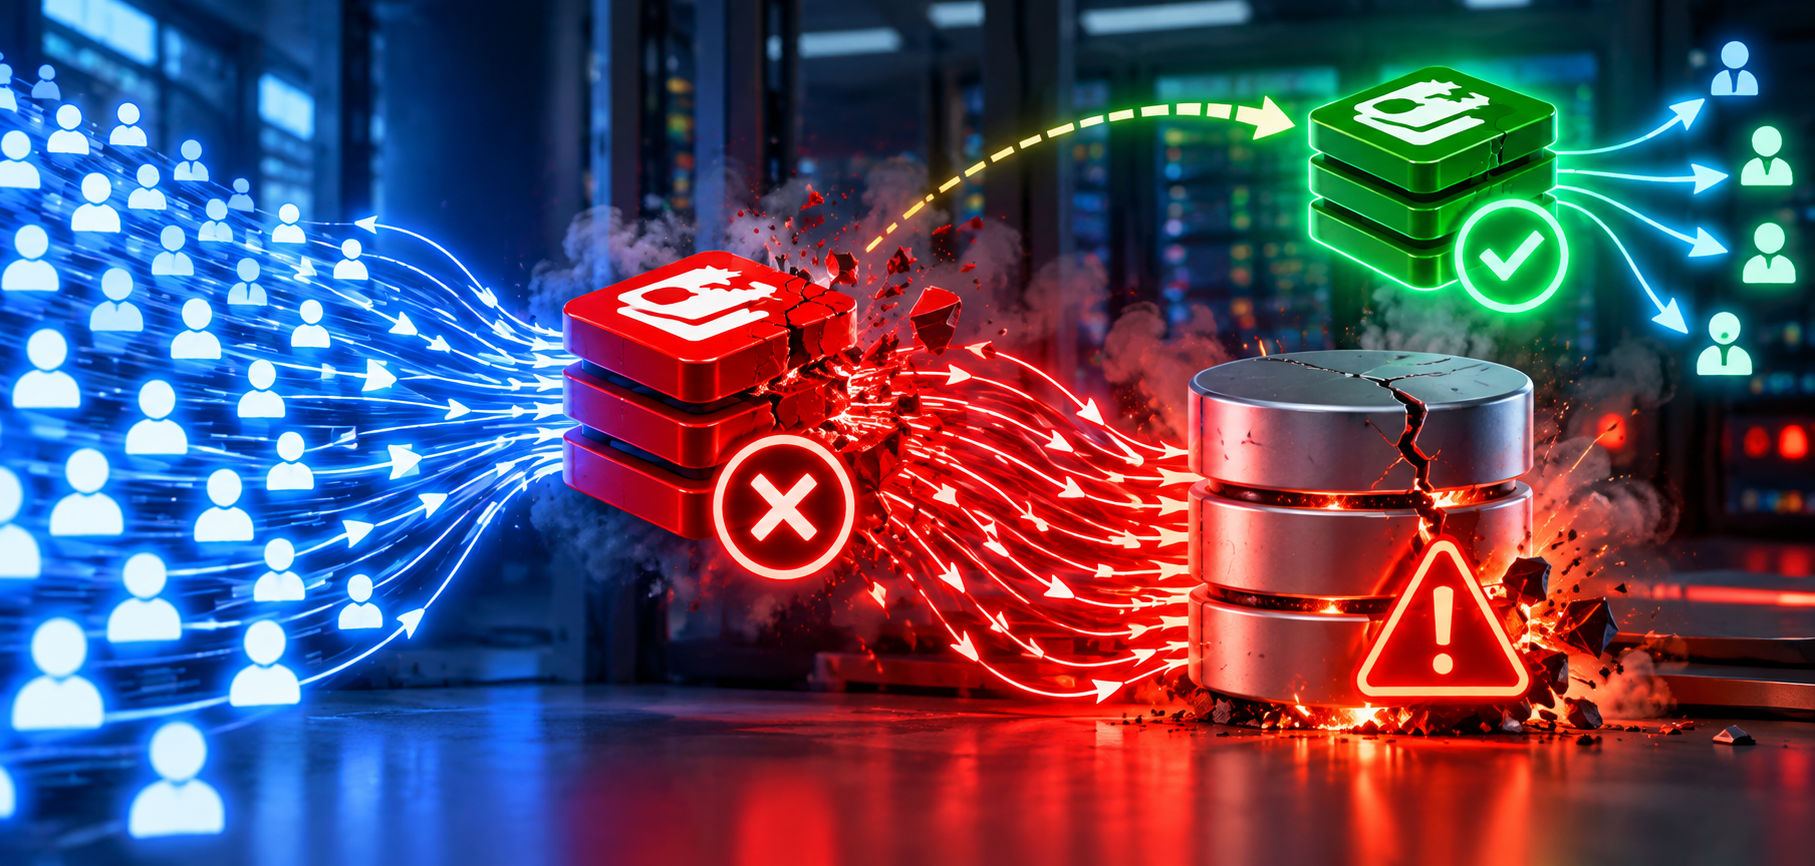
If SQL Server reaches its capacity, adding more API servers may not increase the overall throughput.
The database has become the bottleneck.
Latency and Asynchronous Processing
Some operations do not need to finish before returning a response.
For example, sending an email after an order is created.
Instead of making the user wait:
flowchart LR
    User --> API
    API --> EmailService
    EmailService --> User
we can process the email asynchronously:
flowchart LR
    User --> API
    API --> Queue
    Queue --> EmailService
The API can return the order response while the background service processes the email.
This can reduce the latency experienced by the user.
Latency Percentiles
Average latency does not always tell the complete story.
Suppose we have 100 requests:
- 95 requests complete in 100 ms.
- 5 requests complete in 3 seconds.
The average may hide the fact that some users are experiencing very slow responses.
This is why production systems often monitor percentiles such as:
- P50 – 50% of requests are faster than this value.
- P95 – 95% of requests are faster than this value.
- P99 – 99% of requests are faster than this value.
For example:
P50 = 80 ms
P95 = 200 ms
P99 = 800 ms
This gives us a better understanding of the user experience.
What Happens When Traffic Increases?
Imagine our system currently handles:
2,000 requests/second
Average latency = 100 ms
Traffic increases to:
10,000 requests/secondIf the system does not have enough capacity, queues may grow, CPU usage may increase and database operations may become slower.
As a result, latency may also increase.
flowchart TD
    TrafficIncrease --> MoreRequests
    MoreRequests --> ResourceUsage
    ResourceUsage --> HigherLatency
This shows why throughput and latency need to be considered together.
Key Takeaways
- Latency is the time taken to complete an operation.
- Throughput is the amount of work processed during a period.
- API throughput is commonly measured in requests per second.
- Low latency means requests complete quickly.
- High throughput means the system can process a large workload.
- Database bottlenecks can affect both latency and throughput.
- Caching can reduce latency and database load.
- Asynchronous processing can reduce user-facing latency for suitable operations.
- P95 and P99 latency provide more useful information than averages alone.
Conclusion
Latency and throughput describe two different aspects of system performance.
Latency tells us how quickly an individual request is completed, while throughput tells us how much work the system can process over time.
A system handling thousands of requests per second is not necessarily fast for every user, and a system with very low latency for one request may not be able to handle large traffic.
Good System Design considers both.
Next, we will look at one of the most important concepts in distributed systems: CAP Theorem.